Ongoing Science Request a pilot

A product of Ongoing Science

OS. The shared workspace for research groups.

Chat, tasks, data, analysis and writing on one record, with AI built in, designed to make analyses, reports and manuscripts reproducible and verifiable.

A research group works in ten places at once: email, group chat, a spreadsheet, a shared drive, a to-do app, a notebook, the cluster, a calendar, slides and a word processor. One system instead of ten tools: this is OS, the shared workspace for research groups: it keeps a project’s work together, analyses its data and drafts its reports and papers.

  1. Keeps the work togetherChat, tasks, files and calendar of a project, linked and searchable.
  2. Analyses data of any kindReads, plates, images, cohorts: the assistant proposes the steps, a person accepts them.
  3. Drafts reports and papersEvery number comes from the run that made it, and a person checks it.

Like a contract research lab, in your own group ↓

Any data in, analysis out, and every number can be checked. Like a contract research lab, in your own group: you bring a question and the data; an LLM suggests the analysis steps and a person inspects the code and approves them; your institute’s compute runs it as a numbered run that keeps its code and its inputs; the system confirms what ran, on which data, and only a person says the result is right.

From the run to the report ↓

Write the report in OS, too: your group drafts reports and manuscripts together in the Writer, without leaving the app. You type # to put in a value of a run, and it stays linked to that run; a figure from the analysis goes in with its run. A colleague comments on a passage, you change the text, and the comment is resolved.

Writer mode in OS ↓

Writer mode in OS

AI that writes like a scientific paper. Nothing changes until you accept it.

Writer mode, part of the Writer in OS, brings AI into your writing in a way that suits a manuscript. Our own models are fine-tuned on the language of scientific papers. Every AI edit arrives as a suggestion that you accept or reject, and the document keeps a record of which text came from AI and which you wrote.

Draft

Qwen 3.8 27Boriginal, without our adapter

Writer mode · our modelsuggestion

Real outputs, unedited and replayed from saved runs: seed 1, temperature 0.3, the same prompt for both models. Qwen is an open model from Alibaba Cloud under the Apache 2.0 licence; our adapter is independent and not endorsed by the Qwen team.

Draw the figure ↓

Drawings, the figure editor, finishing a graphical abstract of a phage susceptibility screen: the flask is swapped for its grown-culture version and its fill level set with a slider, the 96-well plate is recoloured, and the last panel, a growth-curve plot found by a German search in the library of 3,054 scientific drawings, is added with its arrow, step number and label before the figure is downloaded as a PDF.

Drawings, as its own product ↗

Drawings

Draw the figure. Free, in your browser.

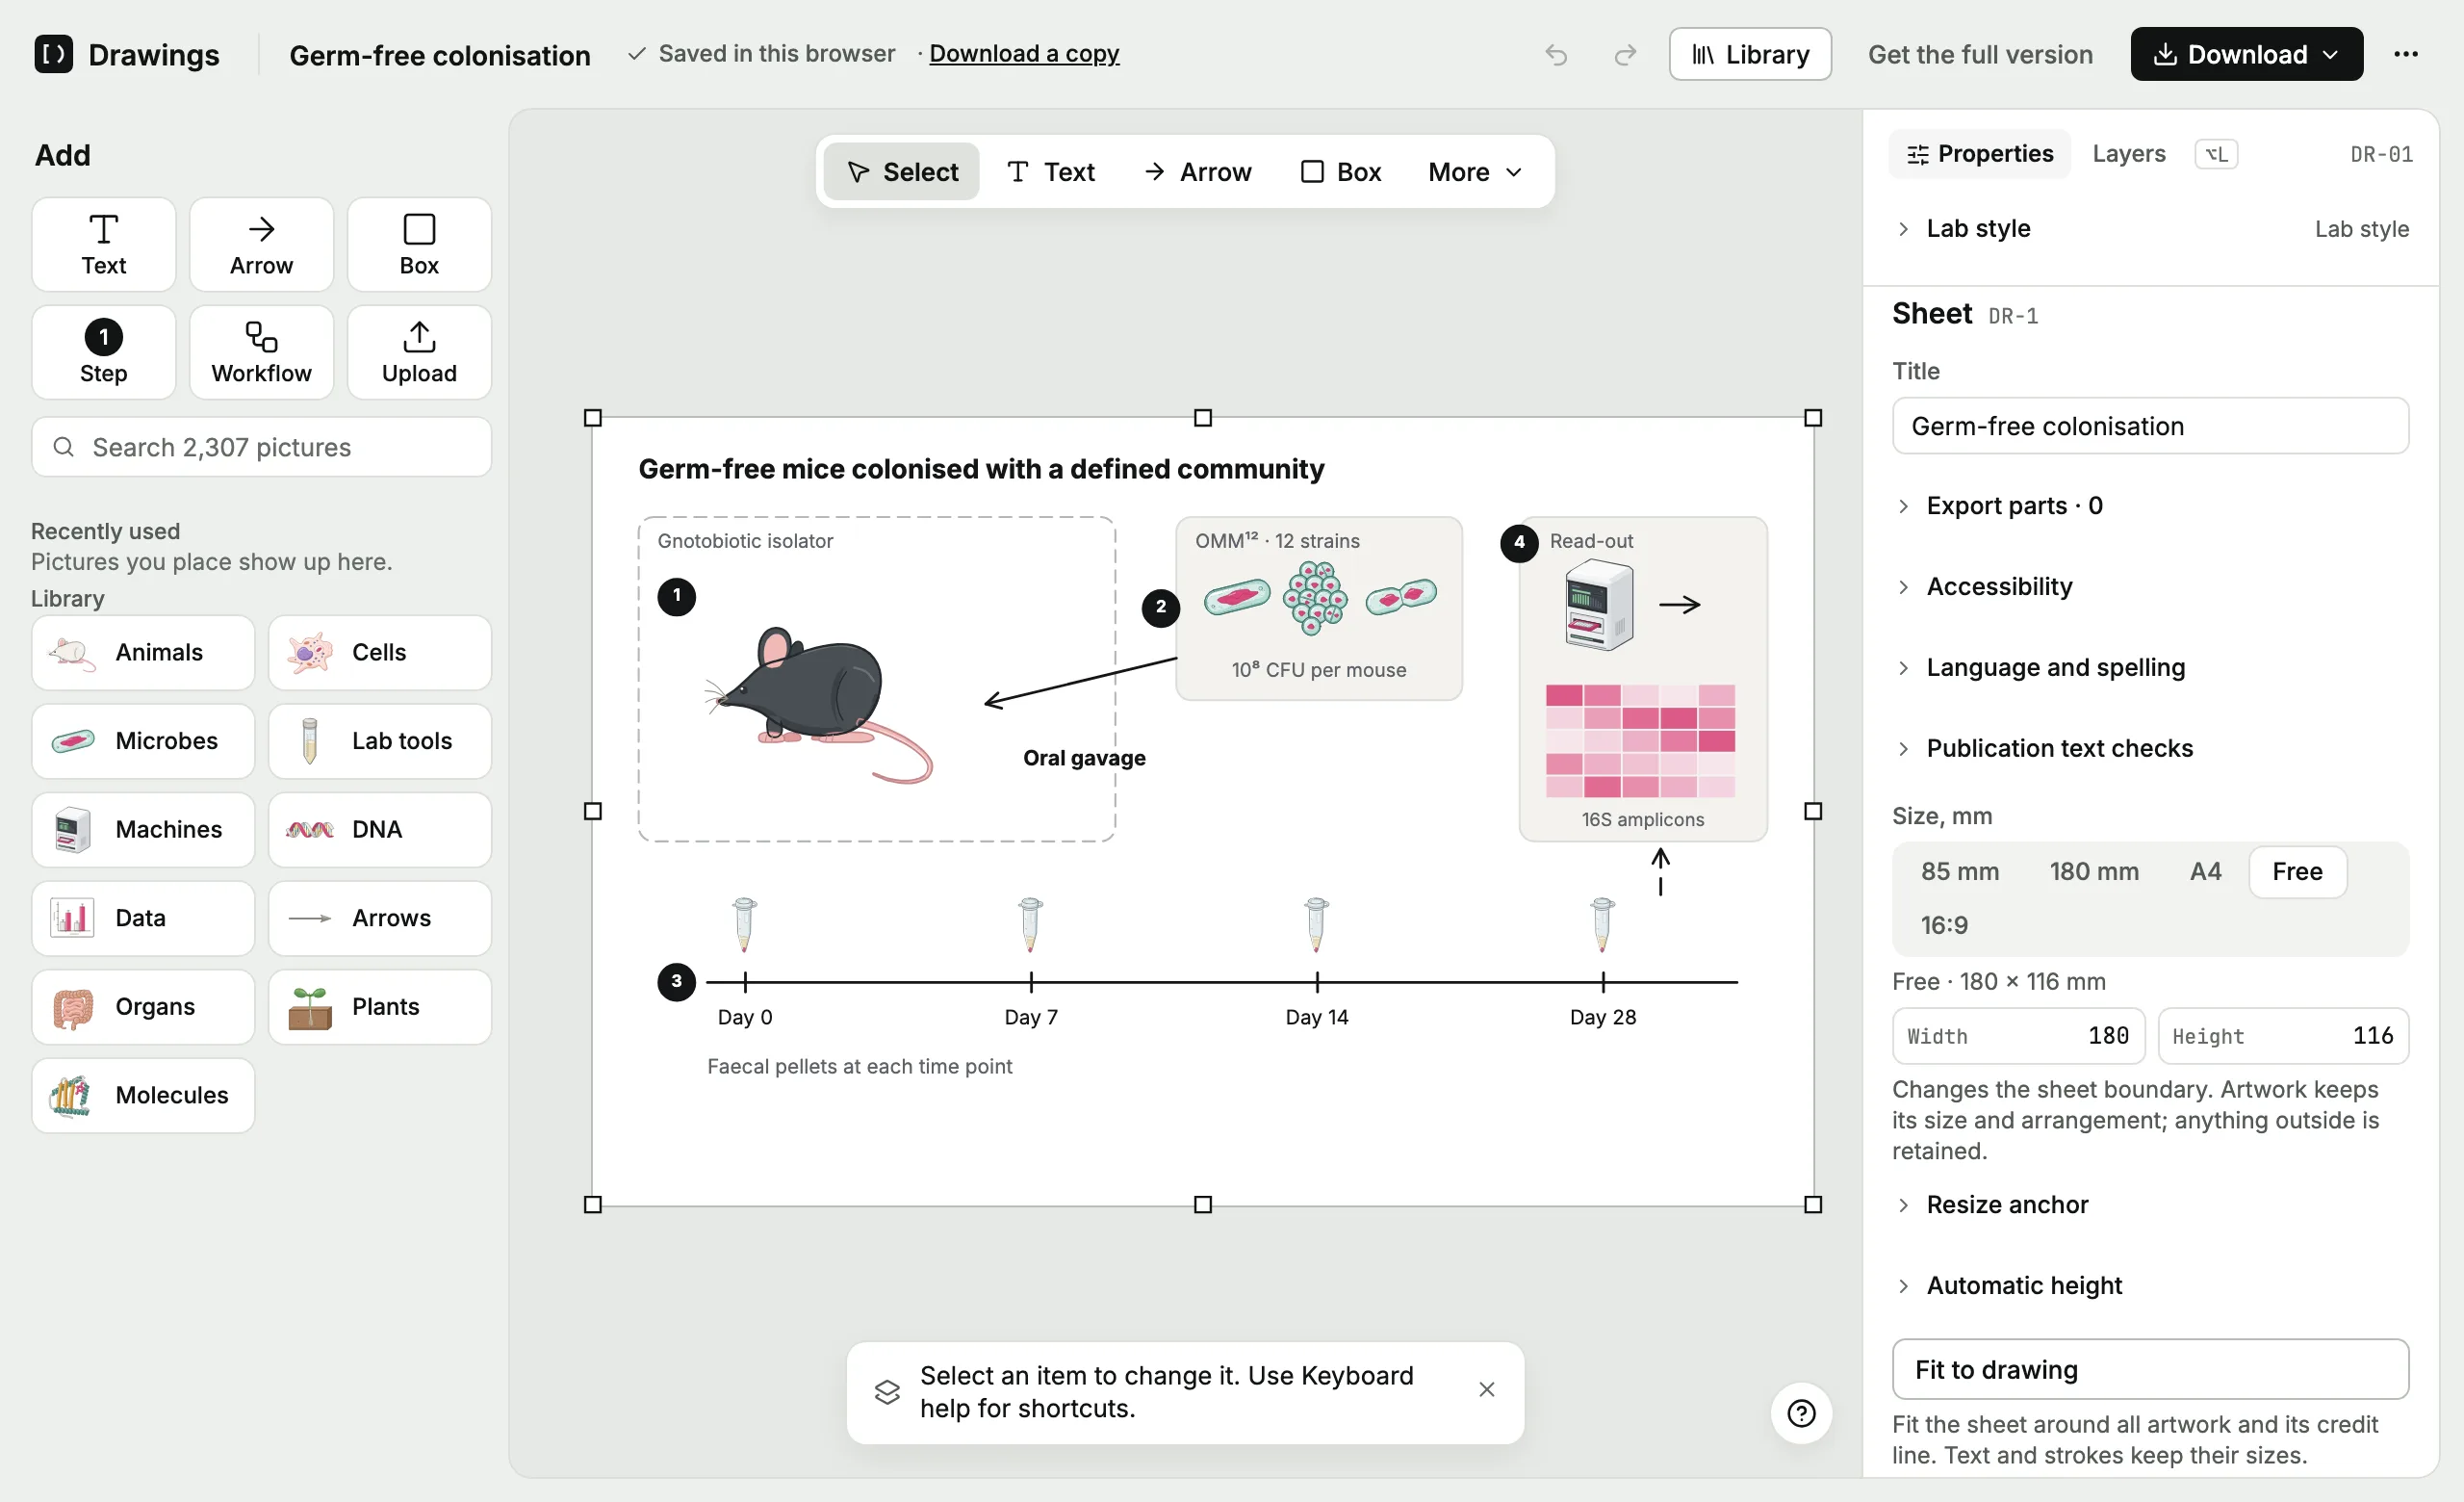
Drawings puts pictures, words, arrows and numbered steps together into a figure for the paper or the poster. The app and the library of 3,054 AI-generated scientific drawings are free to use. No account.

  • 3,054 drawings, in English and German
  • SVG, PDF, PNG ready for the journal
  • Kept in your browser until you download
The Drawings app: the add sidebar beside a figure of germ-free mice colonised with a defined community

From the library

Twelve shelves, from mice and microbes to sequencers and plate readers. Every drawing opens in the app.

See all 3,054 →
MouseMacrophageBacteriumSequencerDNA96-well plateHeatmapPetri dishT cellPipetteZebrafishIntestine

Figures made with it

aDerivation

Crypt isolation
Dome culture

bInfection

Microinjection

cRead-out

Imaging
scRNA-seq

Fig. 3 | Microinjection of bacteria into intestinal organoids. a, Crypts are isolated from a biopsy and grown in a basement-membrane dome. b, Bacteria are microinjected into the organoid lumen. c, Infected organoids are imaged as confocal z-stacks and profiled by single-cell sequencing.

Every element above is a drawing from the library, placed in Drawings. Labels and the legend stay text you can edit.

In OS, Drawings is part of your group’s workspace: drawings are shared, plots stay linked to their data, and the figure goes into the manuscript.

How it is set up ↓

How it is set up

Built so you can trust the process.

Run it on our servers or on yours, with our model, your own, or your institute’s.

Everything can run inside one institute. Or keep compute at home and let us host the collaboration server; your raw data still stays where it is.

For every field of research ↓

Add-ons

For every field of research.

OS is the same system everywhere. An add-on brings the records, instruments and steps of your field.

  • HealthIsolates, drug screens and cohorts.
  • Earth & environmentCores, cruises and time series.
  • EnergyCells, cycling runs and scenarios.
  • InformationDatasets, models and GPU hours.
  • Aeronautics & spaceFlight campaigns and instruments.
  • MatterBeamtime and detector runs.

We build each add-on with an early group in that field. Become the founding lab for yours →

Start with a pilot ↓

Be one of the first labs to run on OS.

We are looking for research groups and institutes to pilot OS with us, and for founding labs to shape the add-on for their field.

Or write to support@ongoingscience.com